By examining key metrics within small increments of launch angles, the Launch Angle report provides valuable insight on the hitter’s swing plane, as well as their ability to adjust their mechanics to maximize performance at higher launch angles.
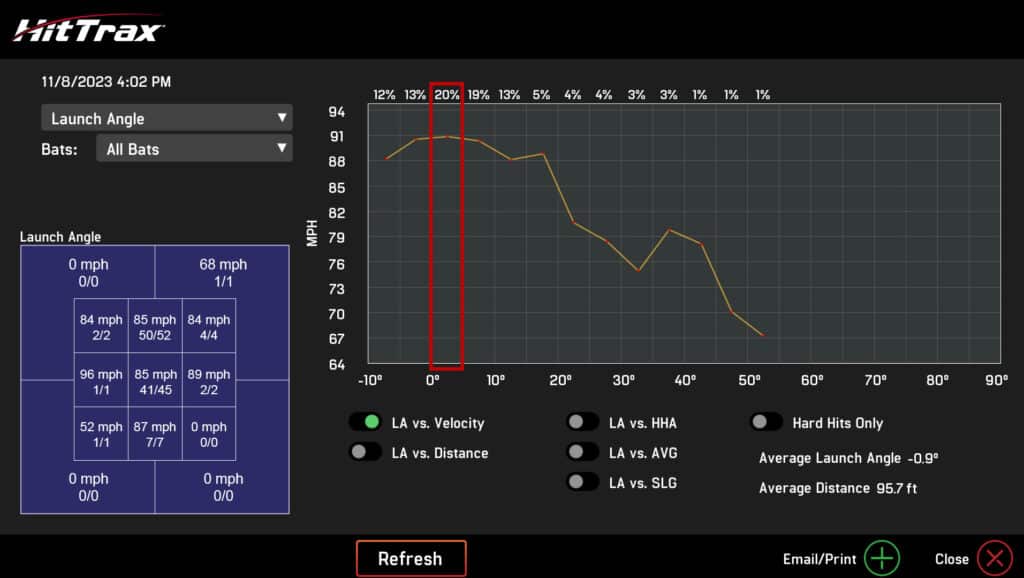
Figure 1
In Figure 1 you will note that launch angles are divided into 5 degree increments from -10 degrees (ground balls) to +90 degrees (pop ups) along the horizontal axis. Depending on the report type selected, the vertical axis lists the average exit velocity (mph), distance, batting average, slugging percentage, or hard hit average (HHA). The average of each metric measured in the hitting session(s) will be plotted accordingly on the line graph for analysis. The 5 degree increments also contain vertical black bars that graphically represent the quantity of hits reported within this range. The corresponding numerical percentage is listed at the top of each column. For example, the red box in Figure 1 illustrates that 20% of all hits measured in this session fell between 0 and 5 degrees.
The strike zone found on the left side, reports the selected metric for each of the (13) sections. You have the ability to analyze each metric by specific sections of the strike zone by simply deselecting the section(s) you wish to omit from the report and hitting the ‘REFRESH’ button. The chart will then update accordingly.
Along with providing detailed insight on performance over specific ranges of launch angle, the report also provides a graphical representation of the hitter’s propensity to hit the ball in the air or on the ground. The three dotted ovals covering the black bars in Figure 2 illustrate the launch angles that typically represent ground balls, line drives and fly balls. In this particular session, it is clear that the majority of the hits were ground balls as 64% of all measured hits fell below a 10 degree launch angle.
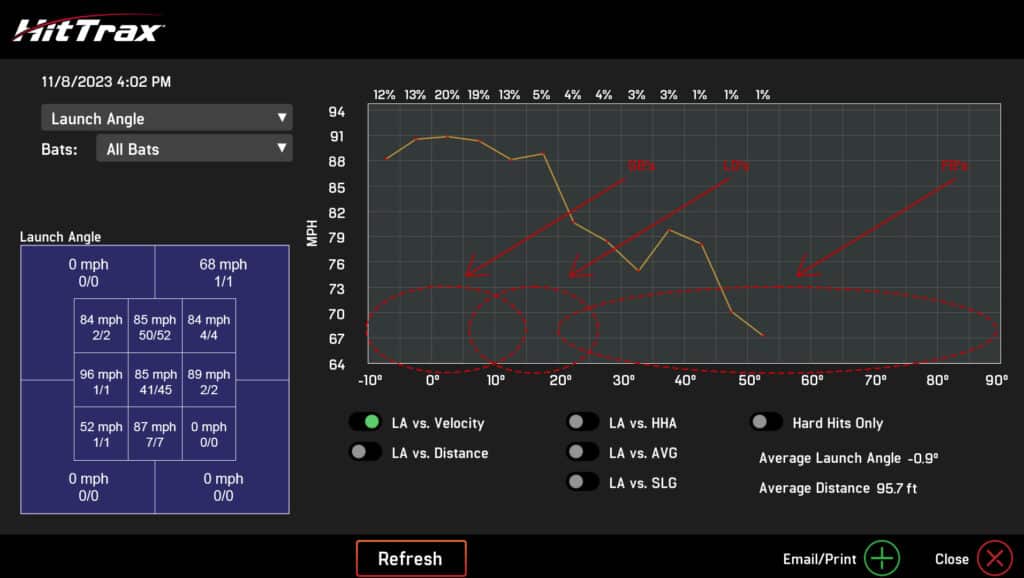
Figure 2
The following is an outline detailing how to interpret each of the Launch Angle reports:
LA versus Exit Velocity
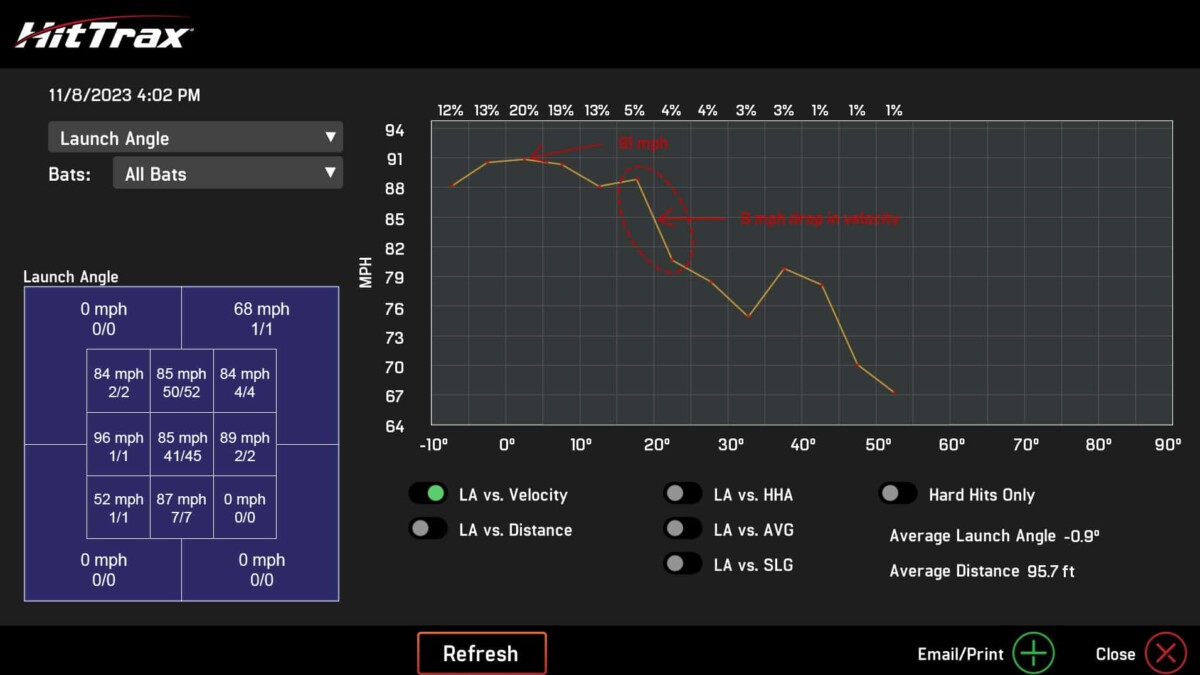
By selecting the ‘LA vs. Velocity’ report, the chart will provide you with the hitter’s average exit ball velocity for each 5 degree increment. For example, in Figure 3 you will see that the hitter’s maximum avg. velocity throughout the entire launch angle range fell between 0 and 5 degrees and was measured to be roughly 91 mph.
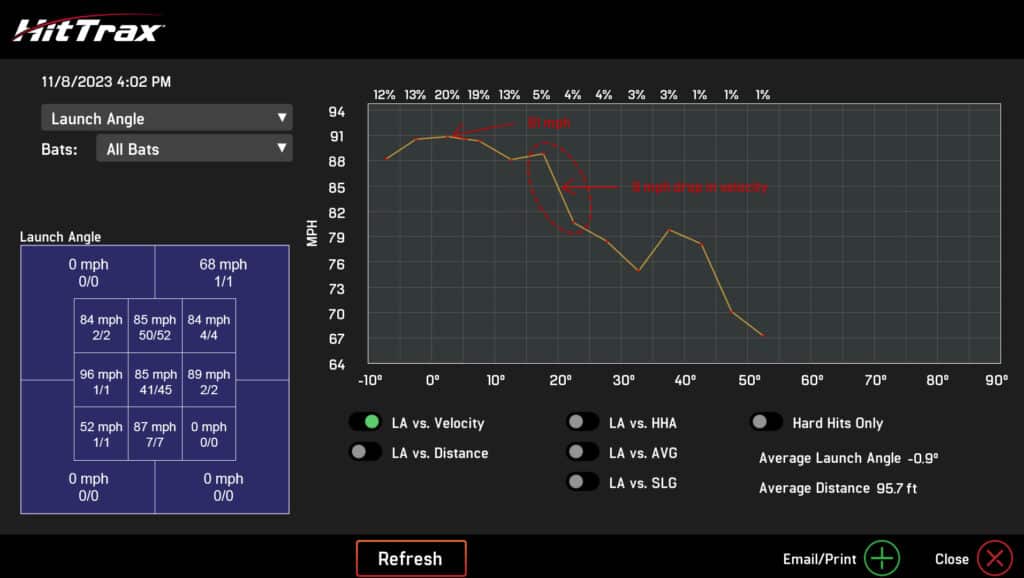
Figure 3
Following the basic principle that the highest possible exit velocity of a hit will occur when the ball exits along the same path as the swing plane of the bat, the chart implies that this hitter has a relatively flat swing plane as the peak velocity occurs at angles that are relatively parallel to the ground (0 deg.). Furthermore, the hitter fails to adjust their swing when driving the ball at higher launch angles as the avg. exit velocity decreases sharply when the angle reaches 20 degrees. This ~ 9 mph drop in velocity translates into a 45 ft. decrease (1 mph = 5 ft.) in the distance of a hit.
The report also lists the overall average launch angle and distance for all hits recorded in the session and/or date range. In this specific case, the hitter’s average launch angle was – 0.9 degrees, which indicates that there were a high number of ground balls recorded during this session. The average distance for all hits was calculated to be 95.7 ft., which further indicates that the hitter was not able to drive the ball past the infield for a majority of the session.
Figure 4 shows a follow-on session by the same hitter that occurred roughly 50 days after the first session.

Figure 4
Notable changes from the first session include:
- Increase in maximum exit velocity to over 93 mph (occurring from 0 to 10 degrees)
- Maintaining peak velocity at higher launch angles (no sharp drop off)
o Indicates hitter is adjusting swing plane
o Distance of hits between 20 to 25 degrees increased by 60 ft.
12 mph change * 5 ft. / 1 mph = 60 ft. - The average launch angle for the session increased to 16.4 degrees from -0.9 degrees
- The average distance for all hits increased to 208.4 ft. from 95.7 ft.
LA versus Distance
As shown in Figure 5, selecting the ‘LA vs. Distance’ button below the chart will change the vertical axis to display the average distance for each 5 degree increment. This information can be used to determine which 5 degree increment produces the furthest hits – in this case, 35 to 40 degrees with a distance of ~ 345 ft. You can also use this report to monitor & chart progress as the hitter increases exit velocity and/or improves swing mechanics.
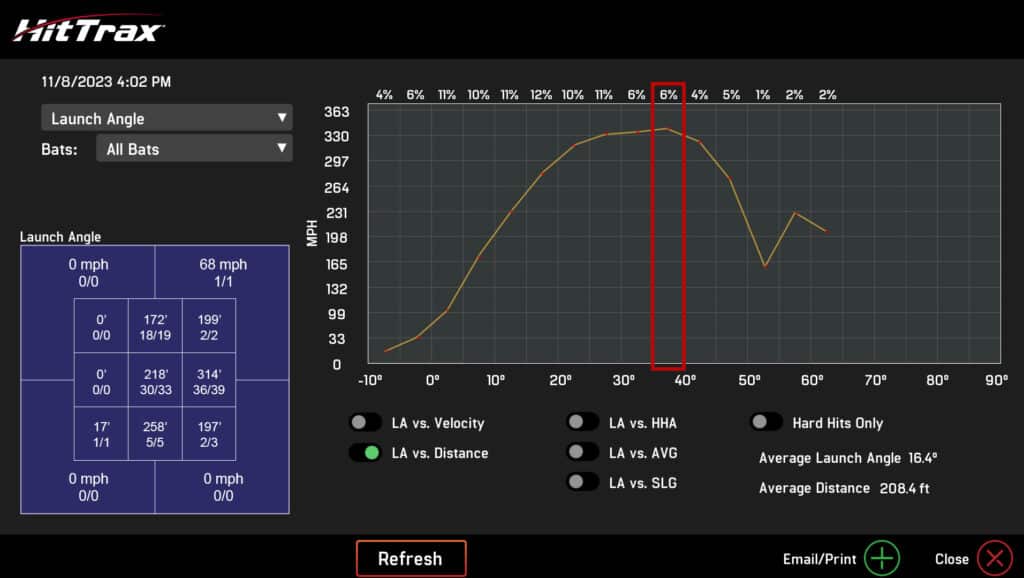
Figure 5
LA versus AVG, SLG and HHA
Selecting the ‘LA vs. AVG’, ‘LA vs. SLG’ and/or ‘LA vs. HHA’ will change the vertical ‘y’ axis to show the percentages for the players Batting Average, Slugging Percentage and Hard Hit Average for each 5 degree increment. All three categories can be displayed individually or simultaneously. Charting these metrics will show the player at which 5 degree increment they are having the most success.
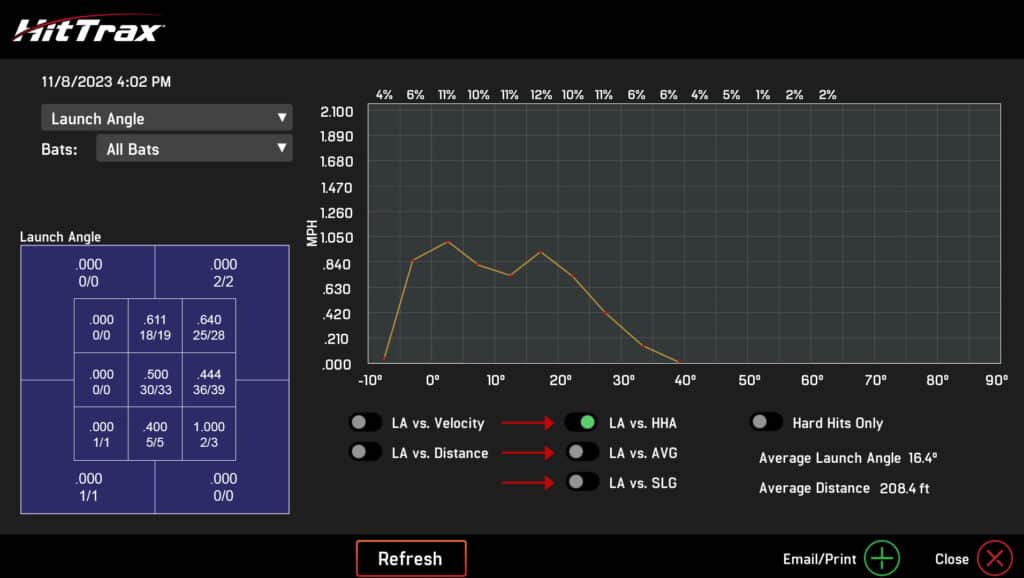
Figure 6